Page 441 - My FlipBook
P. 441
:
HISTORY OF DENTAL SURGED Y 401
State Graduates Non- Per cent
Graduates Total Graduates
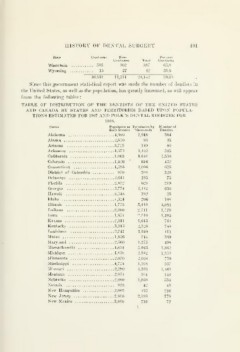
Wisconsin 585 302 887 65.9
Wyoming 15 27 42 35.6
16,831 11,311 28,142 59.08
Since this government statistical report was made the number of dentists in
the United States, as well as the population, has greatly increased, as will appear
from the following tables
TABLE OF DISTRIBUTION OF THE DENTISTS OF THE UNITED STATES
AND CANADA BY STATES AND TERRITORIES BASED UPON POPULA-
TIONS ESTIMATED FOR 1907 AND POLK'S DENTAL REGISTER FOR
1908.
States Population to Population by Number of
Each Dentist Thousands Dentists
Alabama 4,000 2,018 504
Alaska 2,820 93 33
Arizona 3,725 149 40
Arkansas 4,373 1,422 303
California 1,063 1,648 1,.550
Colorado 1,426 ' 616 432
Connecticut 1,593 1,006 625
District of Columbia 970 308 329
Delaware 2,644 195 73
Florida 2,872 629 219
Georgia 3,754 2,444 650
Hawaii 8,348 192 23
Idaho 1,324 206 148
Illinois 1,755 5,419 3,081
Indiana 2,300 2,711 1,179
Iowa 1,854 2,210 1,193
Kansas 2,111 1,613 764
Kentucky 3,115 2,320 748
Louisiana 3,747 1,540 411
Maine 1,836 714 389
Maryland 2,560 1,275 498
Massachusetts 1,634 3,043 1,862
Michigan 1,858 2,582 1,353
Minnesota 2,670 2,026 759
Mississippi 4,724 1,708 357
Missouri 2,290 3,363 1,469
Montana 2,054 304 148
Nebraska 2,000 1,069 534
Nevada 933 42 45
New Hampshire 2,005 433 216
New Jersey 2,806 2,196 779
New Mexico 3,000 216 72
HISTORY OF DENTAL SURGED Y 401
State Graduates Non- Per cent
Graduates Total Graduates
Wisconsin 585 302 887 65.9
Wyoming 15 27 42 35.6
16,831 11,311 28,142 59.08
Since this government statistical report was made the number of dentists in
the United States, as well as the population, has greatly increased, as will appear
from the following tables
TABLE OF DISTRIBUTION OF THE DENTISTS OF THE UNITED STATES
AND CANADA BY STATES AND TERRITORIES BASED UPON POPULA-
TIONS ESTIMATED FOR 1907 AND POLK'S DENTAL REGISTER FOR
1908.
States Population to Population by Number of
Each Dentist Thousands Dentists
Alabama 4,000 2,018 504
Alaska 2,820 93 33
Arizona 3,725 149 40
Arkansas 4,373 1,422 303
California 1,063 1,648 1,.550
Colorado 1,426 ' 616 432
Connecticut 1,593 1,006 625
District of Columbia 970 308 329
Delaware 2,644 195 73
Florida 2,872 629 219
Georgia 3,754 2,444 650
Hawaii 8,348 192 23
Idaho 1,324 206 148
Illinois 1,755 5,419 3,081
Indiana 2,300 2,711 1,179
Iowa 1,854 2,210 1,193
Kansas 2,111 1,613 764
Kentucky 3,115 2,320 748
Louisiana 3,747 1,540 411
Maine 1,836 714 389
Maryland 2,560 1,275 498
Massachusetts 1,634 3,043 1,862
Michigan 1,858 2,582 1,353
Minnesota 2,670 2,026 759
Mississippi 4,724 1,708 357
Missouri 2,290 3,363 1,469
Montana 2,054 304 148
Nebraska 2,000 1,069 534
Nevada 933 42 45
New Hampshire 2,005 433 216
New Jersey 2,806 2,196 779
New Mexico 3,000 216 72