Page 92 - My FlipBook
P. 92
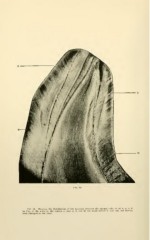
Fig. 46. Showing the distribution of the brownin between the enamel rods, as at A, B, c. D.
In Fig. 47 the color in the section is just as it was in the tooth before it was cut. not having
been changed in the least.