Page 515 - My FlipBook
P. 515
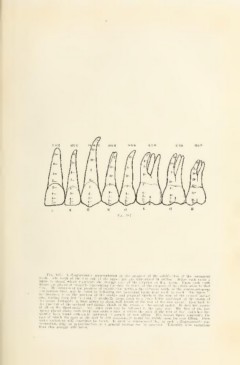
^^1 "JKigraiiiiiKUic ifiiiescntatiun of the progress nf th(> calcififution o( the permanent
,,
, teem, ilip teetli i of the left side of tile njiper jaw are represented in outline.
igure IS placed which represents the siveuige year of the eruption of that tnoth. Below each tooth a
Upon each tooth
figriires are placed at intervals representing the date, in veais. of the progress of its calcification to that
hiiie I he relation of the progress of ealciflcatioii between the dilierent teeth, or the contemporaneous
calcihcation lines, nia.v be found b.v following anv individual fifnire from tooth to tooth. The figure 7,
for insiance. is on the junction of the middle and gingival
thirds of the root of the central incisor
and, reading from left to right, it graduall.v drops down to a little below midlcngth ol the crown of
I he second bicuspid; it then jumps to about half length of the root of the first molar: then back to
Ihe junction of the occlusal and middle thirds of the crown of the second molar.
It does not appear
at all on the third molar. Anv other ,>eav niav be followed in the same wav. The first of the two
hgures placed above each tooth represents a date at which the apex of the root of that tooth has
fre-
quently been found sufficiently narrowed to permit of root tilling. The second figure represents the
date at which the apex of the root is still occasionally found too widely open for root fillin" Kven
wider variations will sometinies be found.
It must be remembered that' in such a diagrammatic rep-
resentation, only an approximation to a general average can be expected.
from this average will occur. Tolerablv wide variation"