Page 483 - My FlipBook
P. 483
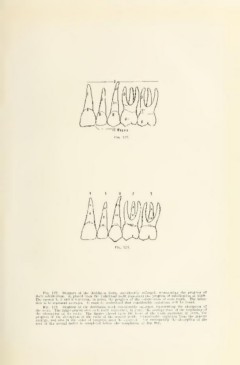
Fio. 172. Diagram of the deciduous tcctn, cunsklerably enlarged, representing tlie progress ol
their calcification. 0, placed upon the individual teeth represents the progress of calcification at birth.
The figures 1, 2 and 3 represent, in years, the progress of the calcification of each tooth. The inten-
tion is to represent averages. It must be understood that considerable variations will be found.
Fig. 173. Diagram of the deciduous teeth considerably enlarged, representing the absorption of
the roots. The figure placed over each tnolh n prcsrnts, in years, the average time of the beginning of
the absorption of its roots. The figures placed upon the roots of the teeth represent, in years, the
progress of the absorption of the roots of the several teeth. Considerable variation from the general
average, and also in the order of progress, must be expected. Not infrequently the absorption of the
root of the second molar is completed before the completion of the first.