Page 411 - My FlipBook
P. 411
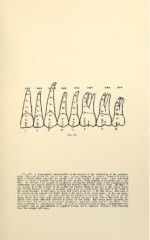
Fig. 187. A diagrammatic representation of the progress of the calcification of the permanent
teeth. The teeth of the left side of the upper jaw are represented in outline. Below each tooth a
figure is placed which represents the aveiage year of the eruption of that tooth. Upon each tooth
figures are placed at intervals representing the date, in years, of the progress of its calcification to that
time. The relation of the progress of calcification between the different teeth, or the contemporaneous
calcification lines, may be found by following any individual figure from tooth to tooth. The figure 7,
for instance, is on the junction of the middle and gingival thirds of the root of the central incisor
and, reading from left to right, it gradually drops down to a little below midlength of the crown of
the second bicuspid ; it then jumps to about half length of the root of the first molar ; then back to
the junction of the occlusal and middle thirds of the crown of the second molar. It does not appear
at all on the third molar. Any other year may be followed in the same way. The first of the two
figures placed above each tooth represents a date at which the apex of the root of that tooth has fre-
quently been found sufficiently narrowed to permit of root filling. The second figure represents the
date at which the apex of the root is still occasionally found too widely open for root filling. Even
wider variations will sometimes be found. It must be remembered that in such a diagrammatic rep-
resentation, only an approximation to a general average can be expected. Tolerably wide variations
from this average will occur.