Page 381 - My FlipBook
P. 381
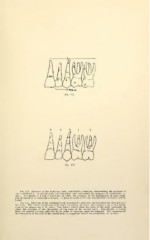
Fig. 172. Diagram f the deciduous teeth, considerably enlarged, representing the progress of
their calcification. 0, placed upon the individual teeth represents the progress of calcification at
birth. The figures 1, 2 and 3 represent, in years, the progress of the calcification of each tooth.
The intention is to represent averages. It must be understood that considerable variations will be
found.
Fig. 173. Diagram of the deciduous teeth < nsiderably enlarged, representing the absorption of
the roots. The figure placed over each tooth represents, in years, the average time of the begin-
ning of the absorption of its roots. The figu res placed upon the roots of the teeth represent, in
years, the progress of the absorption of the roots of the several teeth. Considerabe variation
from the general average, and also in the ord er of progress, must be expected. Not infrequently
the absorption of the root of the second molar is completed before the completion of the first.